


 79 96
79 96

Because
all
patients
from
the
initial
cohort
had
data
on
time
to DR
and
KPS
(both were mandatory
for
inclusion
in
this study), wedecided to apply our finalmodel back to 546 of
the 595 patients who were
initially excluded due
to missing
data
(49 patients were missing
follow-up data). This allowed
us
to
test
the model
built
on
the
cohort
of patients with
all
data
in
the
initial
cohort.
The CCI was
0.579.
4.
Discussion
We confirmed
the prognostic value of
the Bajorin criteria
in
our
cohort
of patients with DR
after RC. At 18 mo
after DR,
patients
without
the
presence
of
VMs
and
a
KPS
80%
had
a
cancer-specific–free
survival
of
68%
compared with
patients who had
at
least
one
(55%)
or
even
two
(33%) RFs.
This
is
in
line with previous
studies
that have validated
this
risk grouping
in
the setting of prospective randomized
trials
[21,22]. However,
these and
the
initial
study of Bajorin et al
included
a
selected
group of patients who were
eligible
for
inclusion
in
these
trials,
possibly
introducing
a
selection
bias.
In
addition,
the
patients
included
had
unresectable
and/or metastatic UC
at presentation of both
the
lower
and
upper
urinary
tract.
A
growing
body
of
evidence
suggests
that UCB
and upper
tract urothelial
carcinoma have
similar
yet
different
epidemiology,
natural
history,
treatment,
and
prognosis
[19,23].
Thus we
sought
to
assess
the prognostic
value
of
the
criteria
of
Bajorin
et
al
in
a
common
but
yet
untested clinical
scenario, namely, patients with only
lower
Table
2
– Univariable Cox proportional hazards
regression models
for
the
outcome
of
cancer-specific
death
of
372
patients with
disease
recurrence
after
radical
cystectomy
for
urothelial
carcinoma
of
the
bladder
HR
(95%
CI)
p
value
Clinical
characteristics
Age,
per
10
yr
1.13
(1.00–1.28)
0.059
Sex,
female
vs male
1.65
(1.23–2.21)
0.001
Body mass
index
0.99
(0.97–1.02)
0.6
Smoking
status
0.4
Never
Ref.
–
Former
1.09
(0.82–1.44)
–
Current
0.88
(0.64–1.22)
–
Characteristics
at
radical
cystectomy
Pathologic
T
stage
0.0019
pT1
Ref.
–
pT2
1.44
(0.93–2.23)
0.10
pT3
2.05
(1.39–3.03)
0.0003
pT4
1.76
(1.13–2.74)
0.012
Pathologic N
status,
pN+
vs
pN0
1.31
(1.02–1.68)
0.033
Lymphovascular
invasion,
present
vs
absent
1.27
(0.99–1.62)
0.058
Concomitant
carcinoma
in
situ,
present
vs
absent
0.98
(0.75–1.28)
0.9
Positive
surgical margins
1.38
(0.95–2.00)
0.093
Positive
ureteral margins
1.28
(0.79–2.07)
0.3
Positive
urethral margins
0.69
(0.37–1.26)
0.2
Biologic
characteristics
at
disease
recurrence
ASA
score,
III/IV
vs
I/II
1.69
(1.29–2.21)
<
0.0001
Karnofsky
performance
status,
<
80%
vs
80%
2.05
(1.61–2.62)
<
0.0001
Age-adjusted
Charlson
Comorbidity
Index
1.06
(0.99–1.13)
0.080
Alkaline
phosphatase,
per
1000 U/l
1.03
(0.80–1.31)
0.8
Albumin,
g/dl
0.67
(0.55–0.82)
<
0.0001
Hemoglobin,
g/dl
0.85
(0.79–0.90)
<
0.0001
Lactate
dehydrogenase,
per
1000 U/l
1.41
(1.13–1.77)
0.003
Platelets,
per
100
billion/l
1.10
(1.01–1.20)
0.028
White
blood
cell
count,
billion/l
1.07
(1.04–1.09)
<
0.0001
Treatment
characteristics
Administration
of
adjuvant
chemotherapy
0.89
(0.67–1.18)
0.4
Adjuvant
chemotherapy
regimen
0.5
None
Ref.
Ref.
Non–cisplatin
based
1.14
(0.62–2.10)
–
Cisplatin
based
0.85
(0.62–1.15)
–
Administration
of
salvage
chemotherapy
3.07
(2.37–3.97)
<
0.0001
Salvage
chemotherapy
regimen
<
0.0001
None
Ref.
Ref.
Non–cisplatin
based
3.63
(2.47–5.34)
<
0.0001
Cisplatin
based
3.13
(2.39–4.09)
<
0.0001
Visceral metastasis
1.20
(0.94–1.54)
0.14
No.
of
visceral metastases
1.07
(0.93–1.23)
0.3
Time
to
recurrence,
per
6 mo
0.84
(0.80–0.88)
<
0.0001
ASA
=
American
Society
of Anesthesiologists;
CI
=
confidence
interval;
HR
=
hazard
ratio.
All
variables
are
continuous
except
if
specified.
Table
3
– Multivariable
Cox
proportional
hazards
regression
models
for
the
outcome
of
cancer-specific mortality
of
372
patients with
disease
recurrence
after
radical
cystectomy
for
urothelial
carcinoma
of
the
bladder
HR
(95%
CI)
p
value
Pathologic
T
stage
0.12
pT1
Ref.
–
pT2
0.77
(0.49–1.23)
–
pT3
1.18
(0.77–1.81)
–
pT4
0.97
(0.60–1.56)
–
Pathologic N
stage,
pN+
vs
pN0
0.94
(0.72–1.23)
0.7
Positive
surgical margins
0.78
(0.52–1.17)
0.2
Karnofsky
performance
status,
<
80%
vs
80%
1.90
(1.43–2.53)
<
0.0001
ASA
score,
III/VI
vs
I/II
1.76
(1.33–2.32)
<
0.0001
Albumin,
g/dl
0.84
(0.67–1.07)
0.2
Hemoglobin,
g/dl
0.88
(0.82–0.94)
0.0002
Lactate
dehydrogenase,
per
1000 U/l
1.24
(0.93–1.65)
0.15
Platelets,
per
100
billion/l
0.98
(0.89–1.08)
0.7
White
blood
cell
count,
billion/l
1.05
(1.03–1.08)
<
0.0001
Time
to
recurrenc
e *–
<
0.0001
ASA = American
Society
of
Anesthesiologists;
CI =
confidence
interval;
HR = hazard
ratio.
*
HRs
are
not
shown
due
to
nonlinear modeling.
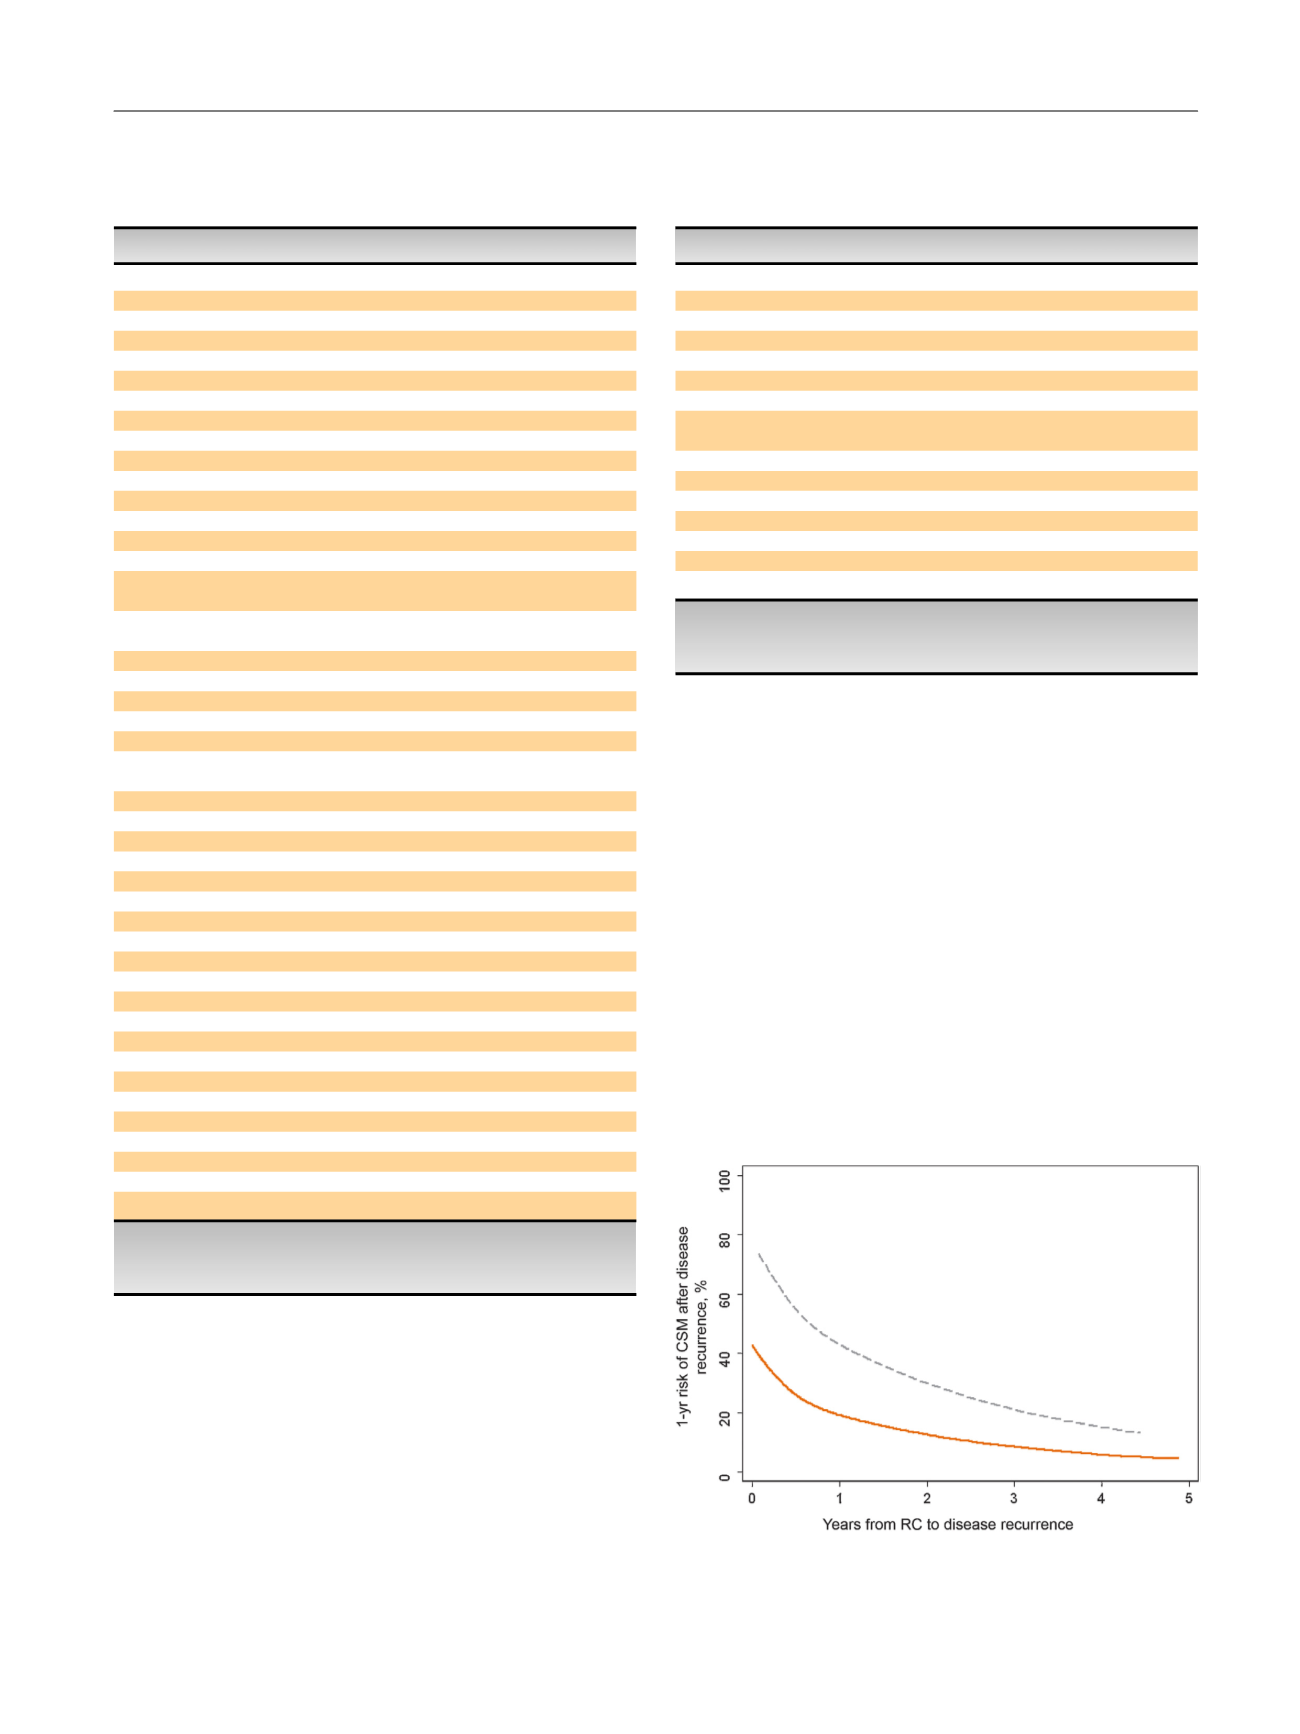
Fig.
2
–
The
1-yr
risk
of
cancer-specific mortality
after
disease
recurrence
by
time
to
disease
recurrence
for
each Karnofsky
performance
status
(KPS)
group.
Solid: KPS
I
80%;
dashed: KPS
<80%.
CSM = cancer-specific mortality;
RC =
radical
cystectomy.
E U R O P E A N
U R O L O G Y
F O C U S
1
( 2 0 1 5
)
7 5 – 8 1
79