


 85 96
85 96

Female
patients with MIBC
had
a
significantly
higher
cumulative
incidence
of
death
from
UBC
than
male
patients
at
17
yr
(80%
vs
67%;
p
<
0.02).
There
was
no
difference
in UBC mortality
between
the
genders
for
pTa
(14%
vs
15%;
p
= 0.56)
and
pT1
tumours
(34%
vs
38%;
p
= 0.58;
Fig. 2 A),
or
for
other
causes
of
death.
Female
patients with
grade
3
tumours
had
a
significantly
higher
cumulative
incidence
of
UBC
death
than
males
(73%
vs
58%;
p
= 0.002), but no difference was observed
for grade 1
(14%
vs
15%;
p
= 0.65)
or
grade
2
tumours
(32%
vs
38%;
p
= 0.23,
Fig. 2B).
3.4.
Cigarette
smoking
At
presentation,
77%
of
patients
were
current
or
previous
smokers
( Table 1 ). As
observed
in
the
general population
at
the
time,
more
men
smoked
(84%)
than
women
(55%;
p
<
0.001,
Table 4). According
to
the
age
or date of
smoking
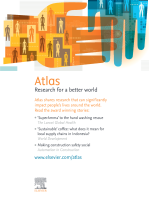
0
25
50
75
100
Proportion surviving (%)
0
5
10
15
Time from treatment/diagnosis (yr)
pTa
pT1
T2-T4
General population survival *
* General population survival for pTa tumours, matched by year of diagnosis, sex, and age
Fig.
1
– Kaplan-Meier
survival
by
tumour
stage
and
estimated
survival
for
the
general
population.
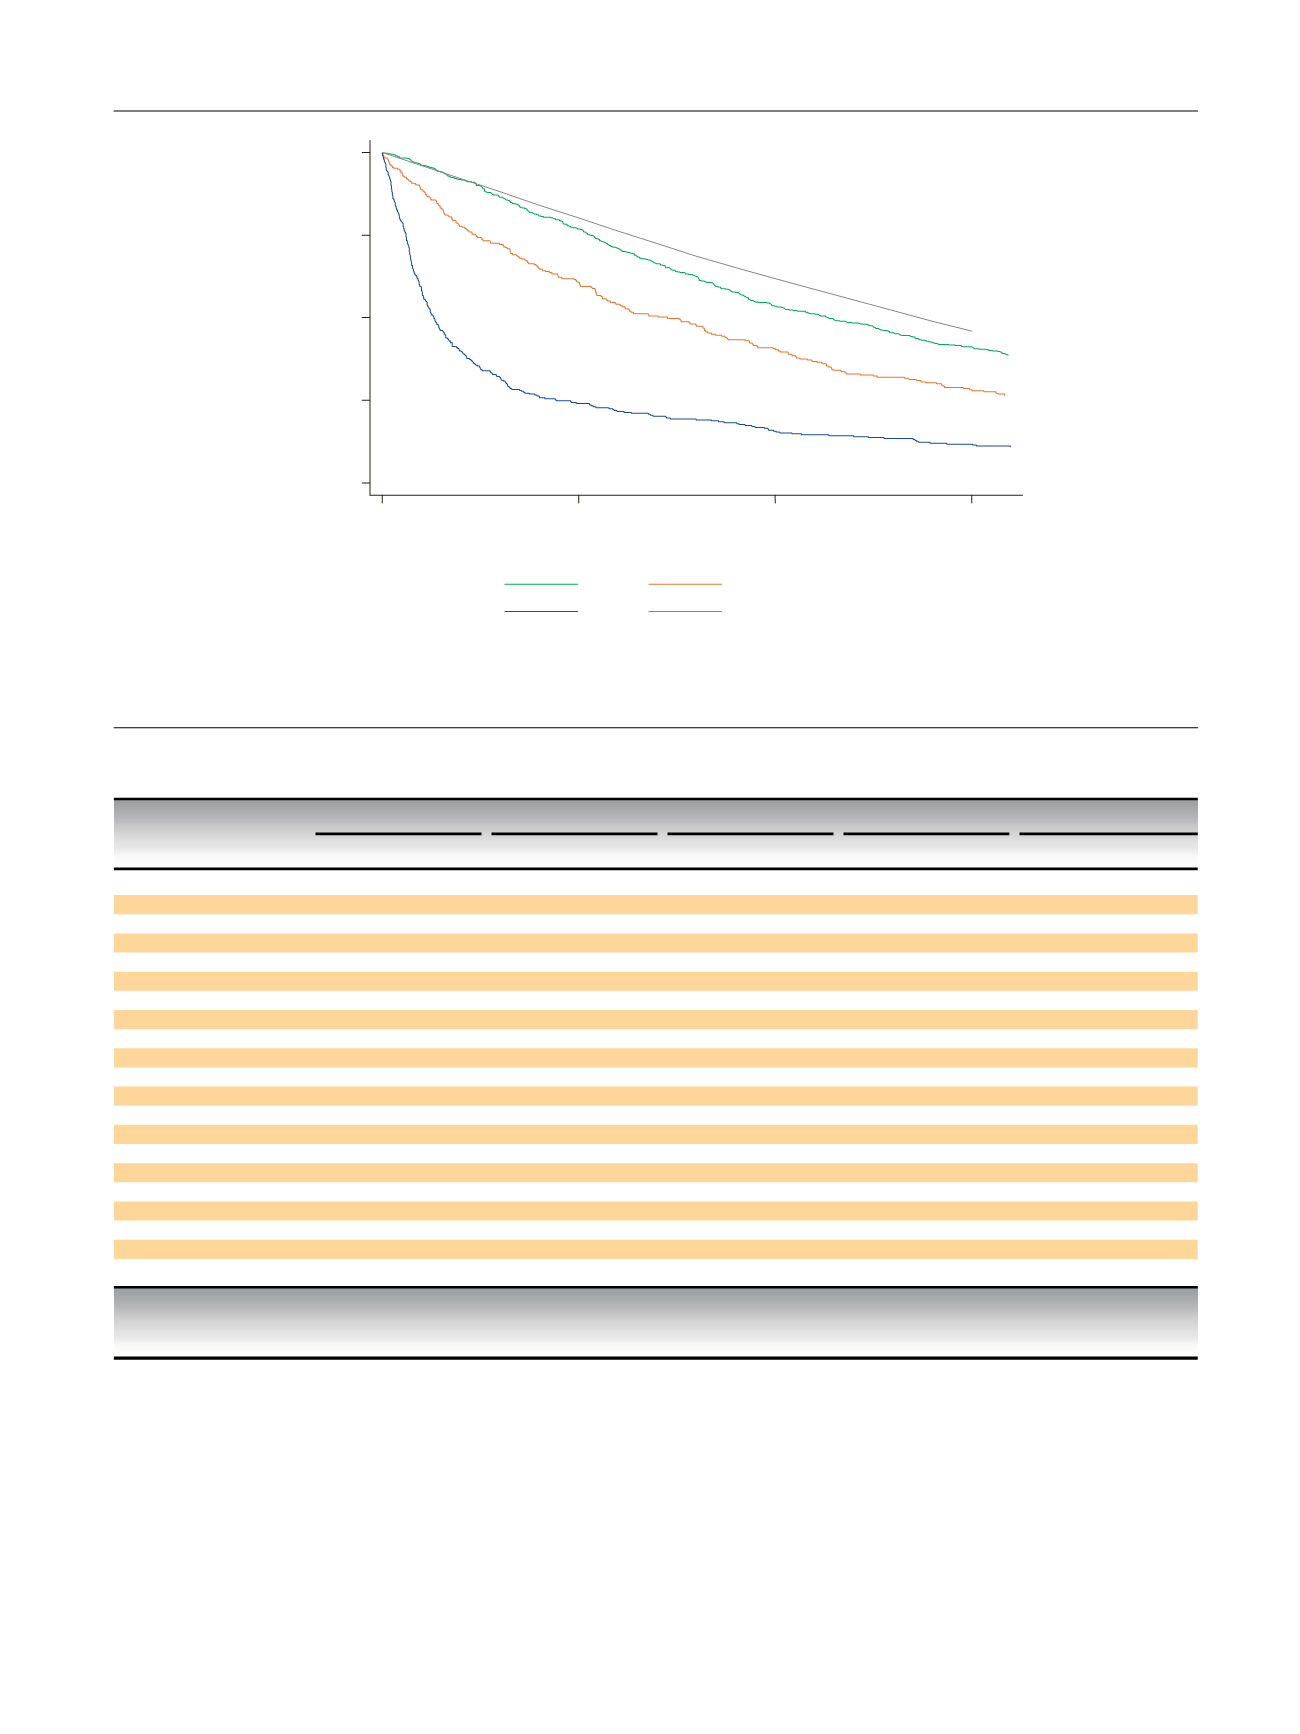
Table
4
–
Patient
characteristics
by
delay
times
Factor
n
Time
1
Time
2
Time
3
Hospital
delay
Total
delay
14
d
>
14
d
28
d
>
28
d
20
d
>
20
d
68
d
>
68
d
110
d
>
110
d
Median
age,
yr
(IQR)
70
(62–77)
69
(61–76)
69
(61–76)
70
(62–77)
70
(62–77)
69
(62–76)
70
(62–76)
69
(62–76)
69
(62–76)
70
(62–76)
Sex,
n
(%)
Male
1097
548
(76)
523
(72)
553
(75)
518
(73)
511
(73)
560
(76)
549
(74)
525
(74)
558
(77
) *513
(72
) *Female
381
171
(24)
199
(28)
184
(25)
187
(27)
193
(27)
178
(24)
188
(26)
184
(26)
168
(23)
203
(28)
Tumour
stage,
n
(%)
pTa
658
340
(54)
314
(48)
345
(52)
309
(50)
312
(51)
342
(51)
321
(49)
333
(52)
320
(50)
334
(52)
pT1
291
140
(22)
149
(23)
140
(21)
149
(24)
131
(21)
158
(24)
148
(23)
142
(22)
146
(23)
143
(22)
T2–4
351
154
(24)
186
(29)
176
(27)
164
(26)
168
(27)
172
(26)
181
(28)
161
(25)
179
(28)
161
(25)
Tumour
size,
n
(%)
2
cm
552
286
(42)
259
(38)
272
(39)
274
(41)
244
(37)
302
(43)
247
(36)
301
(45)
259
(38)
287
(42)
>
2
cm
814
388
(58)
419
(62)
417
(61)
390
(59)
412
(63
) *395
(57
) *439
(64
) *370
(55
) *417
(62)
390
(58)
Haematuria,
n
(%)
Visible
(M)
755
301
(78
) *445
(72
) *452
(75)
149
(73)
259
(73)
487
(75)
405
(73)
343
(75)
390
(76)
356
(72)
Visible
(F)
266
86
(22)
174
(28)
149
(25)
111
(27)
98
(27)
162
(25)
148
(27)
113
(25)
124
(24)
136
(28)
Nonvisible
(M)
52
26
(79)
25
(76)
22
(76)
29
(78)
16
(76)
35
(78)
26
(76)
25
(78)
23
(74)
28
(80)
Nonvisible
(F)
15
7
(21)
8
(24)
7
(24)
8
(22)
5
(24)
10
(22)
8
(24)
7
(22)
8
(26)
7
(20)
None
(M)
64
28
(82)
35
(73)
34
(69)
29
(88)
28
(65)
35
(90)
33
(73)
31
(82)
29
(74)
34
(79)
None
(F)
19
6
(18)
13
(27)
15
(31)
4
(12)
15
(35
) *4
(10
) *12
(27)
7
(18)
10
(26)
9
(21)
Smoking,
n
(%)
Never
287
133
(21)
147
(24)
142
(22)
138
(23)
140
(23)
140
(22)
138
(22)
142
(23)
126
(20)
154
(25)
Ever
973
486
(79)
471
(76)
490
(78)
467
(77)
459
(77)
498
(78)
492
(78)
467
(77)
500
(80
) *457
(75
) *Time 1 =
initial
symptom
to general practitioner
(GP)
referral;
time 2 = GP
referral
to first
consultation;
time 3 =
consultation
to first
treatment;
IQR =
interquartile
range;
M = male;
F =
female.
*
p
<
0.05.
E U R O P E A N
U R O L O G Y
F O C U S
1
( 2 0 1 5
)
8 2 – 8 9
85