


 78 96
78 96

assessed
with
Harrell’s
concordance
index
(10-fold
cross-validation)
[20].
All
statistical
analyses
were
performed
using
Stata
v.12.0
(StataCorp,
College
Station,
TX, USA).
3.
Results
3.1.
Clinicopathologic
characteristics
and
clinical
outcomes
of
967
patients with
disease
recurrence
after
radical
cystectomy
Table 1shows
the
clinicopathologic
characteristics
of
the
967 patients who experienced DR after RC. The median
age
was 66 yr
(interquartile
range: 59–74). Most of
the patients
(70%)
had
non–organ-confined
pathologic
stage.
At
DR,
567
(59%)
had
a
KPS
>
80%
and
408
(42%)
an
age-adjusted
Charlson
Comorbidity
Index
(CCI)
2
points
(%).
Adjuvant
chemotherapy
and
salvage
chemotherapy
were
adminis-
tered
to
279
patients
(29%)
and
363
patients
(38%),
respectively.
Estimated
CSS
probabilities
were
87%,
70%,
and
42%
at
6,
12,
and
24 mo
after DR,
respectively.
3.2.
Evaluation
of
the
prognostic
value
of
the
Bajorin
criteria
(n = 372)
Overall, 266 patients died during
follow-up, with
a median
follow-up
of
18
mo
for
patients
who
were
alive
at
last
follow-up. With
respect
to
the
Bajorin
criteria,
there were
105
patients
(28%) with
no
RFs,
180
(48%) with
one,
and
87
(24%)
with
two.
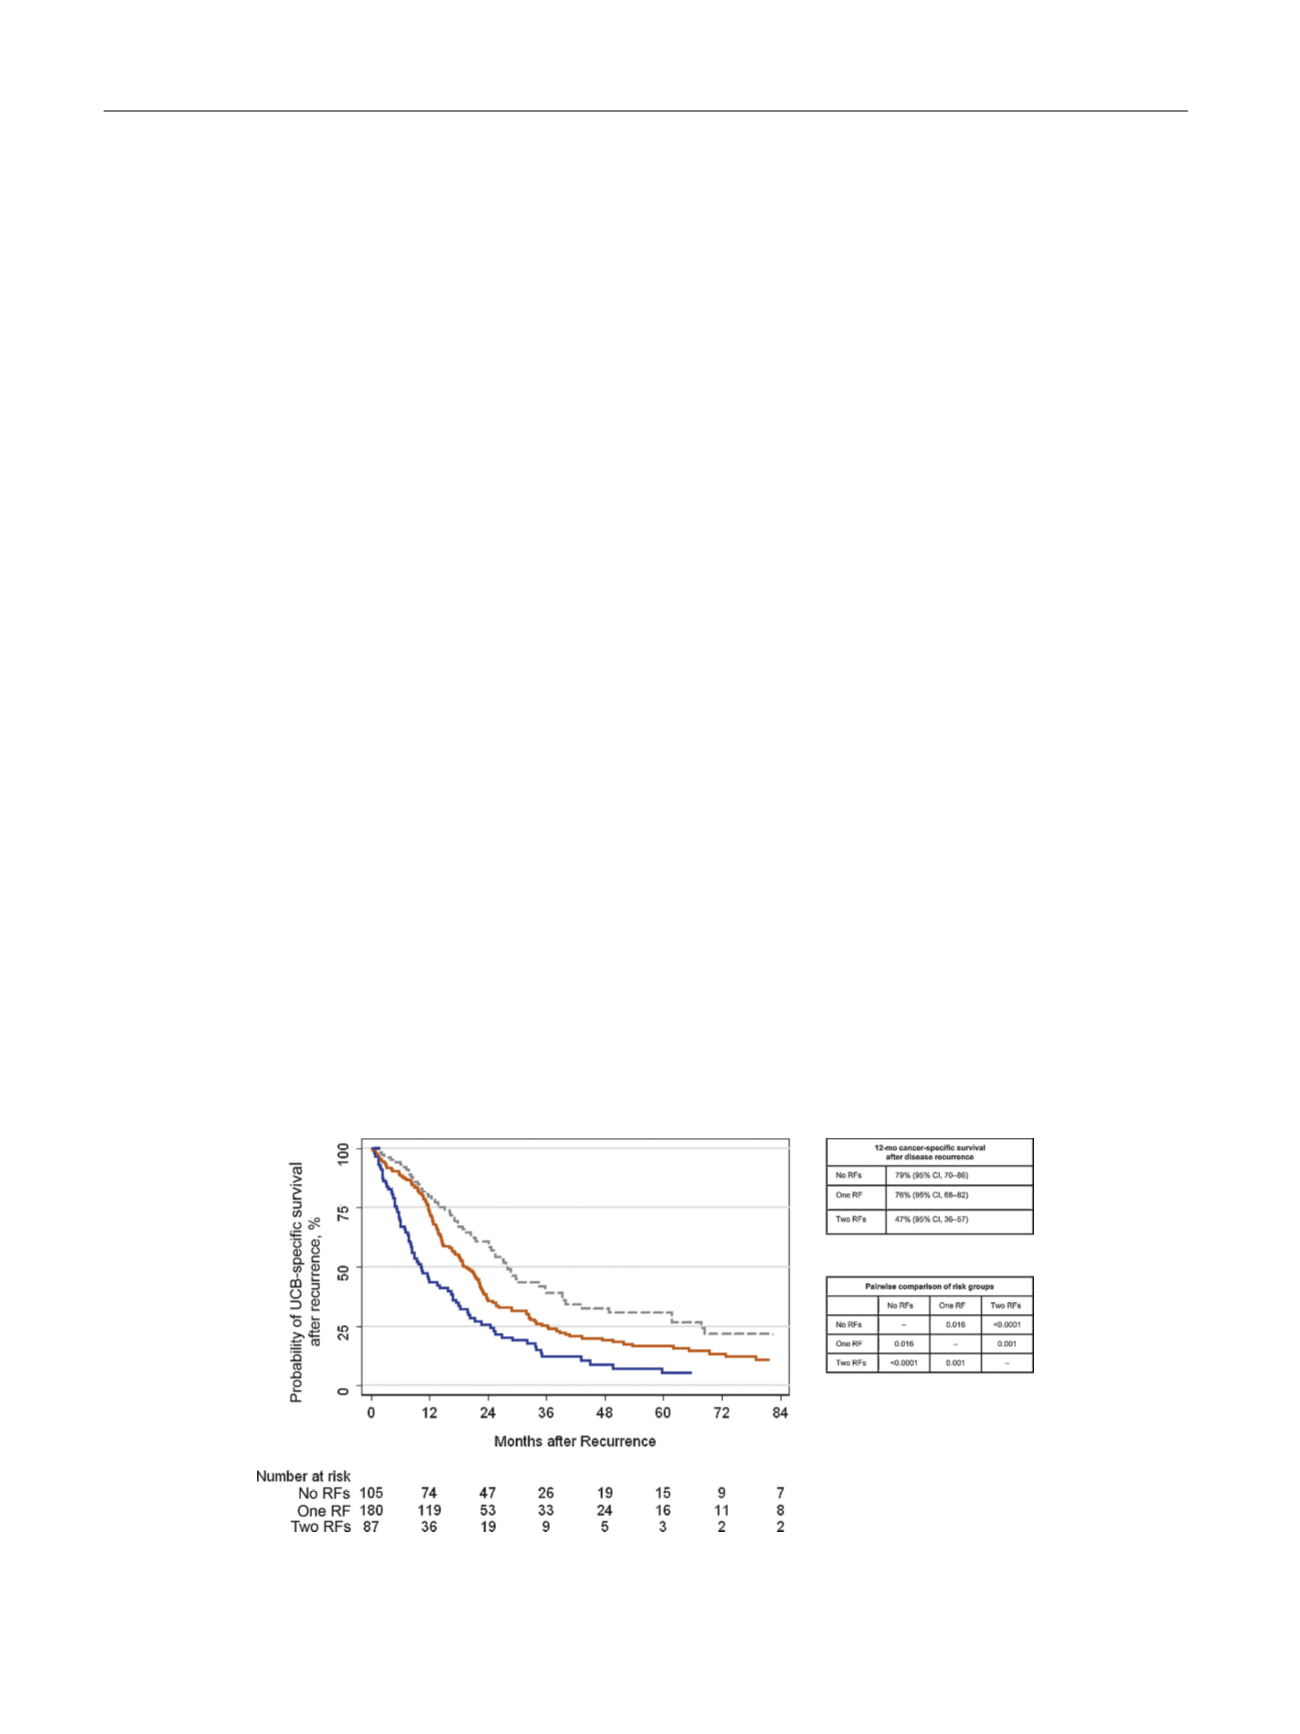
Figure 1displays
the
CSS
curves
stratified
by
Bajorin
risk
group.
Survival
at
1
yr was
79%
(95%
confidence
interval
[CI],
70–86),
76%
(95%
CI,
68–82),
and 47%
(95% CI, 36–57)
for patients with no, one,
and
two
RFs,
respectively
(
p
<
0.0005).
3.3.
Univariable
Cox
proportional
hazards
regressions
for
prediction
of
cancer-specific mortality
Table 2lists
the
findings
of
univariable
analyses
for
CSM.
We
found KPS
(hazard
ratio
[HR]:
2.05;
95%
CI,
1.61–2.62;
p
<
0.0001)
but
not
VMs
(HR:
1.20;
95%
CI,
0.94–1.54;
p
= 0.14)
to be significantly associated with CSM. Finally, we
found
a
shorter
time
to
DR
(
p
<
0.0001)
to
be
associated
with
an
increased
risk
of
CSM.
3.4.
Multivariable modeling
to
predict
cancer-specific
survival
On multivariable analyses, after adjustment
for
the effects of
standard
clinicopathologic
features,
KPS
<
80%
(
<
0.0001),
lower hemoglobin (
p
= 0.0002), higher white blood cell count
(WBC) (
p
<
0.0001), and shorter time toDR (
p
<
0.0001)were
independently associatedwith an
increased risk of CSM after
DR
( Table 3).
We
next
determined
that
the
Bajorin
risk
group
stratification model
had
a
CCI
of
0.600
for
CSM. When we
included
all
significant
variables
from univariable
analyses
along with
the Bajorin
risk grouping, we
found
the CCI
to be
increased
to
0.744
after
10-fold
cross-validation.
Notably,
time
to DR was
the
first
variable
selected
that
had a CCI of 0.742. Next KPS was added, which
improved
the
CCI by 0.0078. WBC had
the next highest CCI
improvement
of 0.0048; however,
this was below our prespecified
cut-off
of
0.005.
This
left
us with
a
final model
that
consisted
of
time
to DR
(
p
<
0.0001; HR
not
reported
due
to
nonlinear
modeling)
and
KPS
(HR:
2.64;
95%
CI,
2.04–3.42;
p
<
0.0001).
The
CCI
of
this model was
0.694
after
10-fold
cross-validation,
an
increase
of
0.094
over
the
Bajorin
risk
grouping.
Figure 2displays
this model
graphically. We
can
see
large differences between
the probabilities of CSS as
the
time
to DR
increases.
For
example,
for KPS
<
80, we
see
the
probability of mortality decrease
from 43% at 1 yr
to 30% at
2 yr down
to 18% at 4 yr, more
than a halving of risk over
the
course
of
3
yr.
Although
salvage
chemotherapy
was
also
found
to
be
significant, we
did
not
include
it
in
our
final
model
due
to
its
time
dependency. We
also
found
salvage
chemotherapy
to
be
associated
with
decreased
survival,
which
could
be
attributed
only
to
those
patients with
the
worst
prognosis who
received
salvage
treatment.
Fig.
1
– Kaplan-Meier
curve
describing
cancer-specific
survival
stratified
by
risk
groups
based
on
two
risk
factors
(RFs), Karnofsky
performance
status
<80%
and
presence
of
visceral metastases,
in
372
patients with
disease
recurrence
after
radical
cystectomy
for
urothelial
carcinoma
of
the
bladder.
Dashed: no
RFs;
solid
orange:
1 RF;
solid
blue:
2 RFs.
CI = confidence
interval;
RF =
risk
factor; UCB = urothelial
carcinoma
of
the
bladder.
E U R O P E A N
U R O L O G Y
F O C U S
1
( 2 0 1 5
)
7 5 – 8 1
78