


 70 96
70 96

association
between
surgical
treatment
and
postoperative
eGFR at 3 yr
(coefficient –2.36, 95% CI –7.55
to 2.83;
p
= 0.4;
Table 4 ).
Finally,
we
performed
a
sensitivity
analysis
for
patients with missing
eGFR
data
at
3
yr
after
surgery. Data
were not available
for 103
(50%) MIPN patients and 89
(54%)
LRC patients. Compared
to
individuals
for whom
eGFR data
were
available,
these
patients
were
significantly
younger
(median age 59 vs 64 yr;
p
= 0.003) and healthier
(ASA
score
3: 17% vs 26%;
p
= 0.044) and had
lower preoperative eGFR
(median
79
vs
83 ml/min/1.73 m
2
;
p
= 0.03).
This
indicates
that older and sicker patients weremore
likely to be followed
at our
institution over 3 yr. Therefore, the postoperative eGFR
reduction
could be
overestimated
in
our
series.
4.
Discussion
We
compared MIPN
to
LRC
for
the
treatment
of
patients
newly diagnosed with a
single SRM. Several
results deserve
attention.
First,
the
two
treatment
options
provided
similar
oncologic outcomes
at
intermediate-term
follow-up. These
findings are
in
line with previous
reports
[12,25]. Converse-
ly, other
studies have
suggested
that
LRC
is associated with
worse
oncologic
outcomes
compared
to
partial
nephrec-
tomy
[11,16,26], while
a
recent meta-analysis
showed
that
LRC was
associated with
an
approximately
tenfold
higher
risk
of
local
tumor
progression
[15] .However,
all
these
studies
involved highly heterogeneous patient populations,
including
different
proportions
of
cancer-naı¨ve
patients,
single
kidney
patients,
and
patients with
previous
surgery
for
kidney
cancer.
For
example, Desai
et
al
[11]analyzed
a
population
with
a
higher
proportion
of
single
kidney
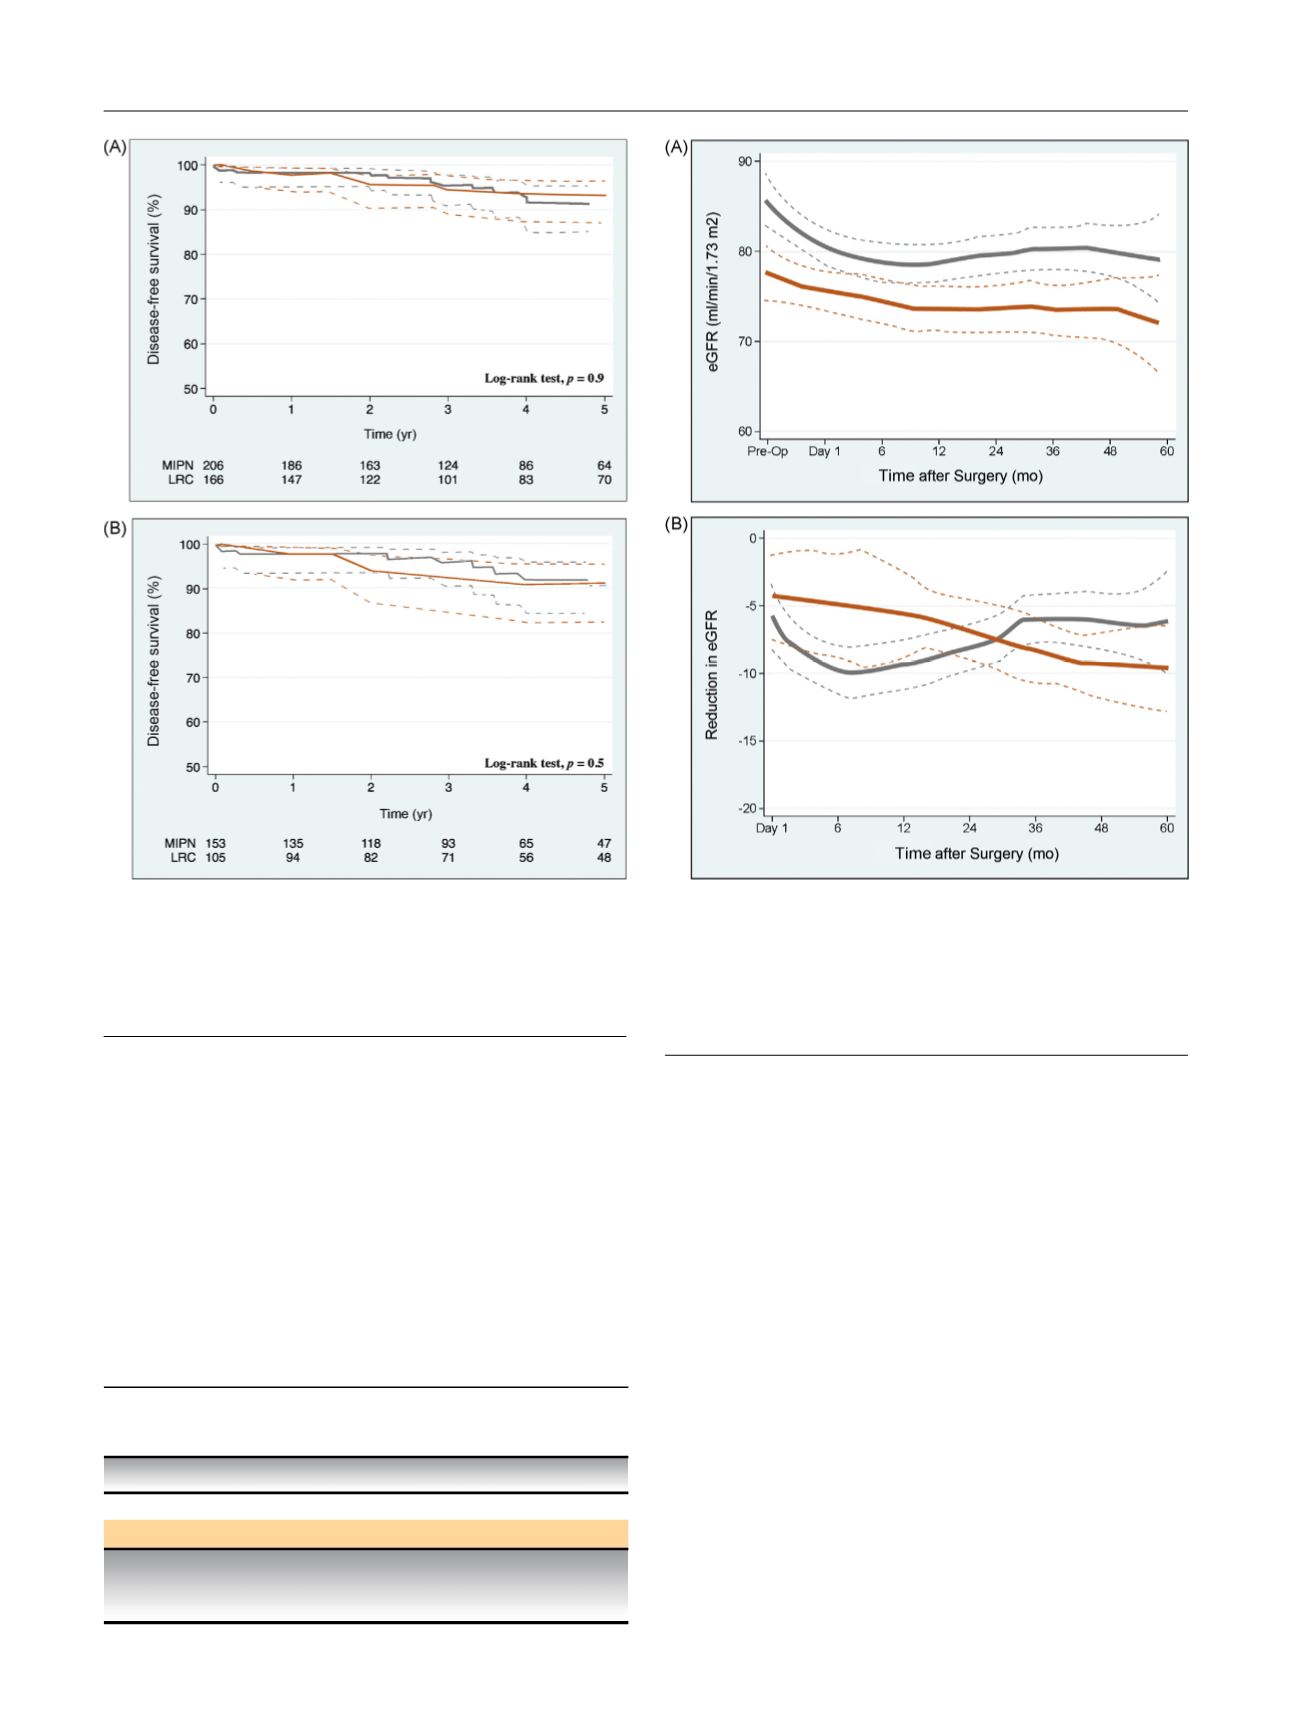
Fig.
1
– Kaplan-Meier
plots
of
disease-free
survival
stratified
according
to
treatment
option
in
(A)
372
patients
newly
diagnosed with
a
single
small
renal mass
and
(B)
patients with
a malignant
lesion
at
final
pathology.
Blue
line: minimally
invasive
partial
nephrectomy
(MIPN).
Red
line:
laparoscopic
renal
cryoablation
(LRC). Dashed
line:
95%
confidence
interval.
Table
4
–
Functional
outcomes
for MIPN
compared
to
LRC
after
adjusting
for
age
at
surgery,
preoperative
eGFR,
and
tumor
size
Outcome
Coefficient
95%
CI
p
value
eGFR
at
6 mo
4.68
0.06–9.30
0.047
eGFR
at
3
yr
–2.36
–7.55
to
2.83
0.4
MIPN = minimally
invasive
partial
nephrectomy;
LRC =
laparoscopic
renal
cryoablation;
eGFR = estimated
glomerular
filtration
rate;
CI =
confidence
interval.
Fig.
2
–
(A) Variation
of
estimated
glomerular
filtration
rate
(eGFR)
and
(B)
percentage
reduction
in
eGFR
in
372
patients
newly
diagnosed with
a
single
small
renal mass,
treated
at
a
single
tertiary
referral
center
between
2000
and
2013,
stratified
according
to
treatment
type.
Blue
line: minimally
invasive
partial
nephrectomy.
Red
line:
laparoscopic
renal
cryoablation.
Dotted
lines:
95%
confidence
interval.
E U R O P E A N
U R O L O G Y
F O C U S
1
( 2 0 1 5
)
6 6 – 7 2
70