


 6 96
6 96

Table
1
(
Continued
)
Country
by
continent
Population, millions,
2013
Income
group
Year
Age
group,
yr
Male,
%
Female,
%
Total,
%
Pakistan
[12]182.1
Lo-mid
2010–2011
40
30.
1 b2.
0 b18.
7 bSri
Lanka
[6]20.5
Lo-mid
2006
15–64
29.9
0.4
15.0
Uzbekistan
[6]30.2
Lo-mid
2006
15
20.0
1.1
10.0
West
Asia
Iran
[6]77.4
Up-mid
2009
15–64
24.6
3.3
14.1
Iraq
[6]33.4
Up-mid
2007
12
26.5
2.9
14.8
Jordan
[6]6.5
Up-mid
2007
18
49.
6 b5.
7 b29.
0 bKuwait
[6]2.9
High
2006
20–64
42.3
4.4
37.8
Lebanon
[6]4.5
Up-mid
2010
18–100
43.2
33.8
38.2
Oman
[6]3.6
High
2008
18
14.7
0.2
7.0
Qatar
[5]2.2
High
2013
15
20.2
3.1
12.1
EUROPE
Eastern
Europe
Bulgaria
[13]7.3
Up-mid
2012
15
42
31
36
Hungry
[13]9.9
Up-mid
2012
15
37
28
32
Latvia
[13]2.0
High
2012
15
52
22
36
Poland
[5]38.5
High
2010
15
36.8
24.4
30.3
Romania
[5]20.0
Up-mid
2011
15
37.4
16.7
26.7
Russia
[5]143.5
High
2009
15
60.2
21.7
39.1
Ukraine
[5]45.5
Lo-mid
2010
15
50.0
11.2
28.8
Southern
Europe
Cyprus
[13]1.1
High
2012
15
42
19
30
Greece
[5]11.0
High
2013
15
51.2
25.7
38.2
Turkey
[6]74.9
Up-mid
2012
15
41.4
13.1
27.0
Western
Europe
Austria
[13]8.5
High
2012
15
40
26
33
Belgium
[13]11.2
High
2012
15
30
24
27
Finland
[13]5.4
High
2012
15
28
22
25
France
[13]66.0
High
2012
15
31
26
28
Germany
[13]80.6
High
2012
15
32
22
26
Ireland
[13]4.6
High
2012
15
28
30
29
Italy
[13]59.8
High
2012
15
28
21
24
Netherlands
[13]16.8
High
2012
15
28
19
24
Norway
[6]5.1
High
2011
16–74
28.0
28.0
28.0
Spain
[13]46.6
High
2012
15
40.0
26.0
33.0
United
Kingdom
[14]64.1
High
2012
16
22.0
19.0
20.0
OCEANIA
Australia
[15]23.1
High
2013
14
18.3
13.4
15.8
New
Zealand
[16]4.5
High
2012–2013
15
18.7
16.4
17.6
Papua–New Guinea
[6]7.3
Lo-mid
2007
15–64
60.3
27.0
44.0
Tonga
[6]0.1
Up-mid
2006
15–64
45.9
12.0
28.8
Lo-mid =
lower-middle
income; Up-mid = upper-middle
income.
*
Smoking
any
tobacco
products
(excludes
smokeless
tobacco
use).
Current
smoking
was
defined
as
current
daily
smoking
or
occasional
smoking
(less
than
daily
smoking)
in
the Global
Adult
Tobacco
Survey
[5].
This
group
included
every
day
and
someday
smokers
in
the US
survey
and
current
smokers
of
‘‘any
amount’’
in
the
Iranian
survey.
Population
and
income
group
data
are
from
the World
Bank.
a
Men
aged
15–59
yr
and women
aged
15–49
yr.
b
Ever
smoking
(current
or
former
smoking).
c
Only
cigarette
smoking.
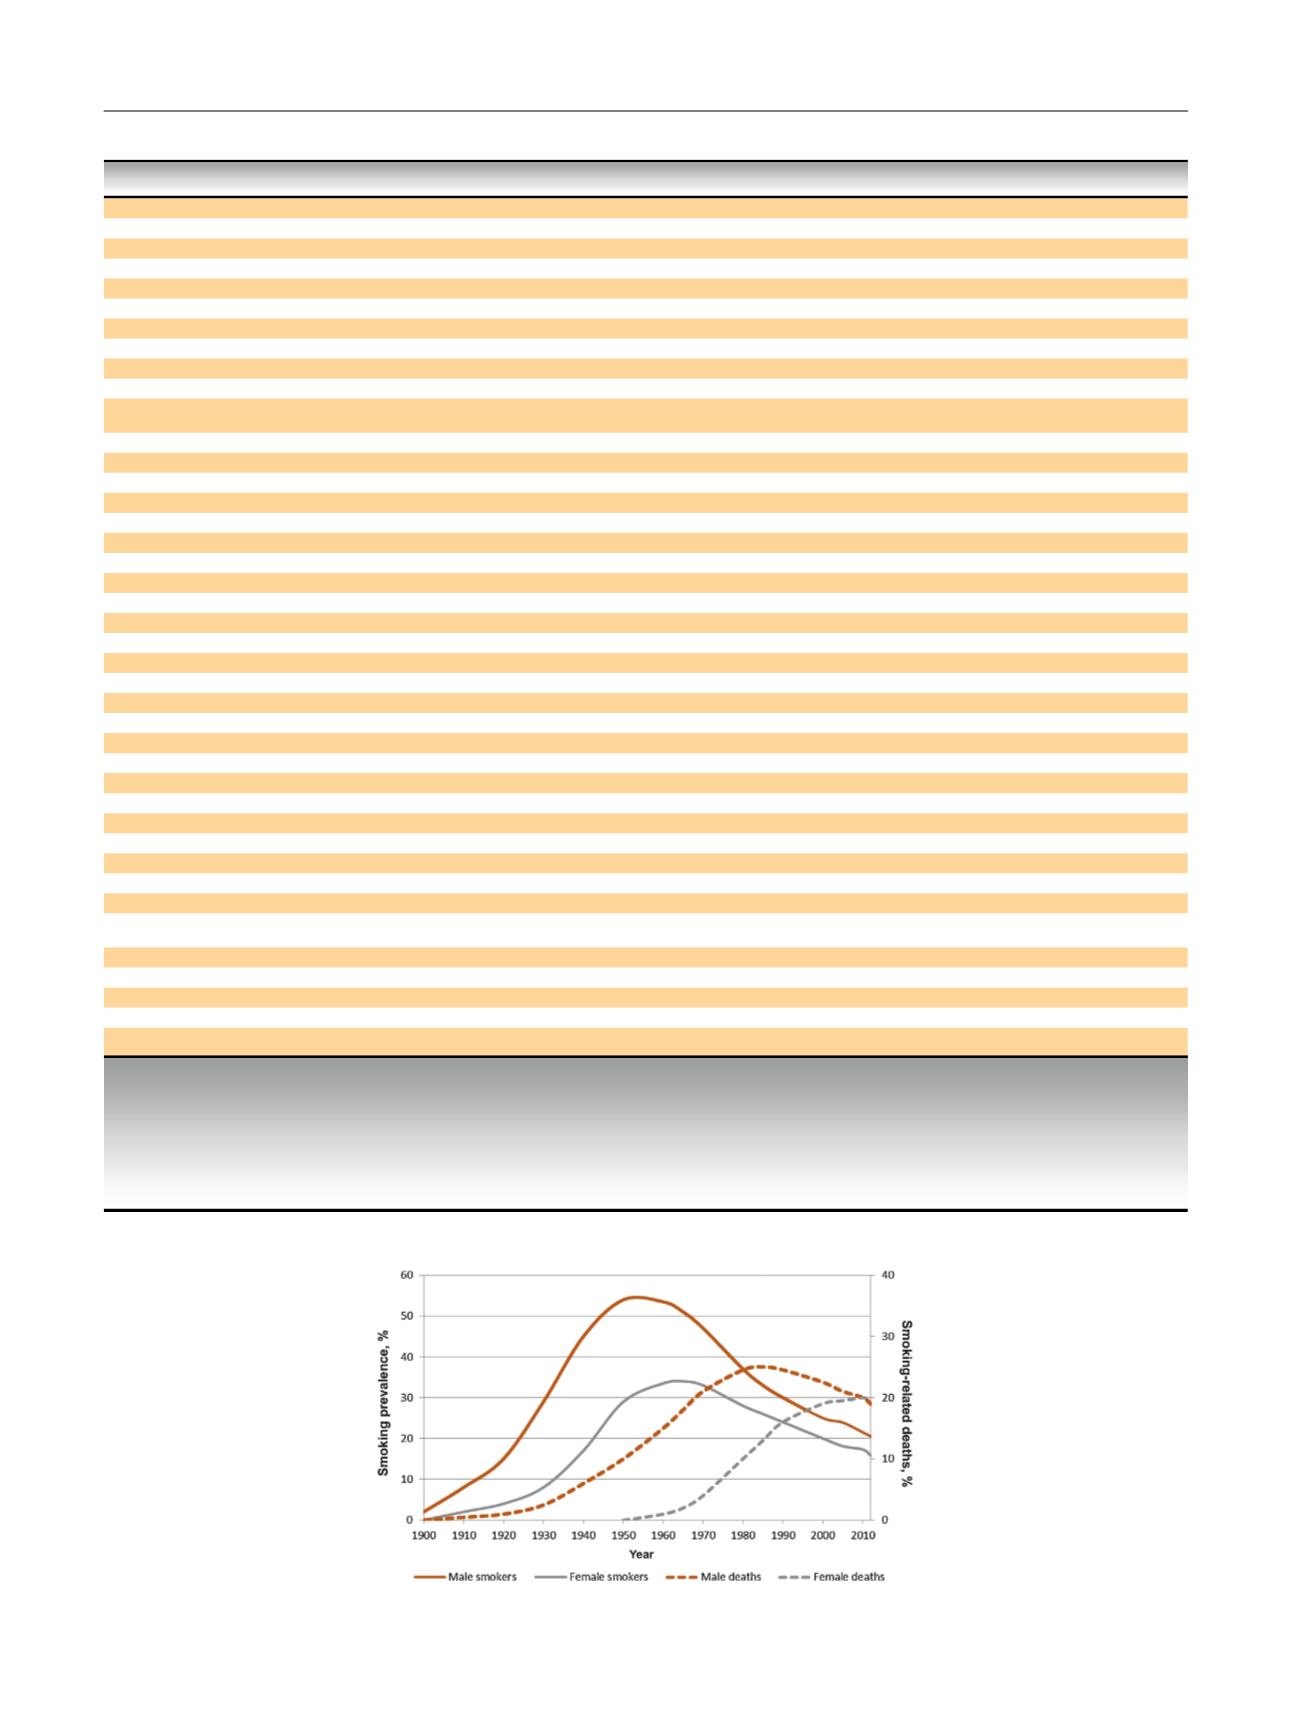
Fig.
1
–
Estimated
cigarette
smoking
prevalence
and
tobacco-related
deaths
in
the United
States,
1900–2012
[8,35] .E U R O P E A N
U R O L O G Y
F O C U S
1
( 2 0 1 5
)
3 – 1 6
6